
- About Us
- Board of Directors
- Sections
- Guiding Documents
- Join APA and Its Divisions
- Contact Us
- Washington Planning Awards Information
- Events & Training
- Professional Development
- Sponsorship
- Get Involved
- Resources
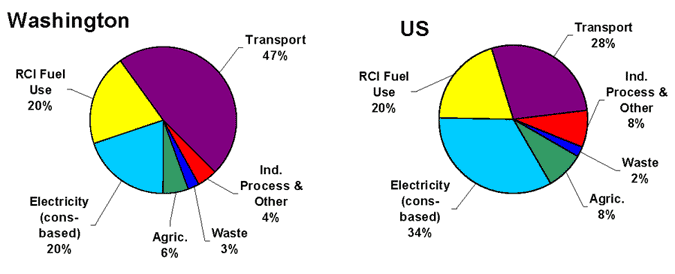
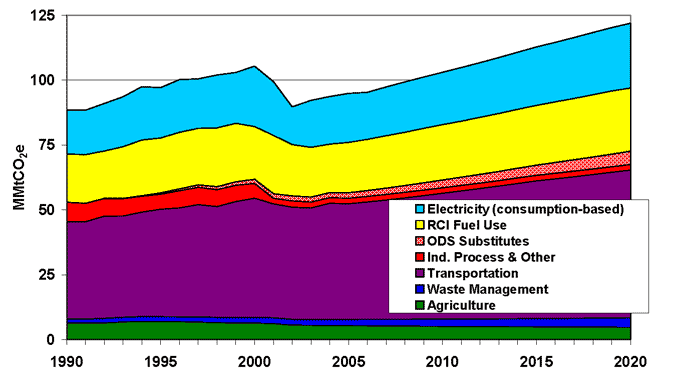
Sustainable Washington2. Climate Change in WashingtonGlobal Warming or Climate Change?These terms are often used interchangeably, but the phrase “climate change” is the preferred term, as it helps convey that there will be additional changes beyond a simple rise in temperatures and that changes in climate will be variable across the planet. Recently published work from the University of Washington’s Climate Impacts Group reinforces the variable effects of climate change — even in our state, noting the different impacts that can be expected in different regions of Washington State. Significantly, the UW report1 notes that evaluating risk under different impact scenarios is still evolving, particularly due to the synergistic nature of cross-sector impacts (e.g., water supply issues are interrelated with any number of other sectors — such as agriculture, land use, energy generation and species survival). Given this understanding, planning for climate change is essentially planning for risk and uncertainty. This differs from the familiar GMA-based planning framework used in Washington State in two important respects — planning for climate change will require us to plan for uncertainty rather than eventuality, and planning for climate change must embrace a much longer-term planning horizon. In an environment where what we understand and can predict is still developing and will be uncertain for some time to come, providing ways to monitor, assess, and to be flexible in our responses will be critical. We must take a long-term view, since deferring action now will only make the cumulative effects more difficult to resolve in the future; the familiar GMA-based 20-year planning timeframe will not be sufficient to address a climate that will likely be in a state of change for 50 to 100 years. Furthermore, the changes we make now (or fail to make) will continue to affect climate change for that long timeframe to come. Climate Change Impacts on WashingtonA recent assessment is contained in a report released by the University of Washington’s Climate Impacts Group (Evaluating Washington’s Future in a Changing Climate, February 2009). The report identified a range of probable impacts on climate in the Pacific Northwest, including:
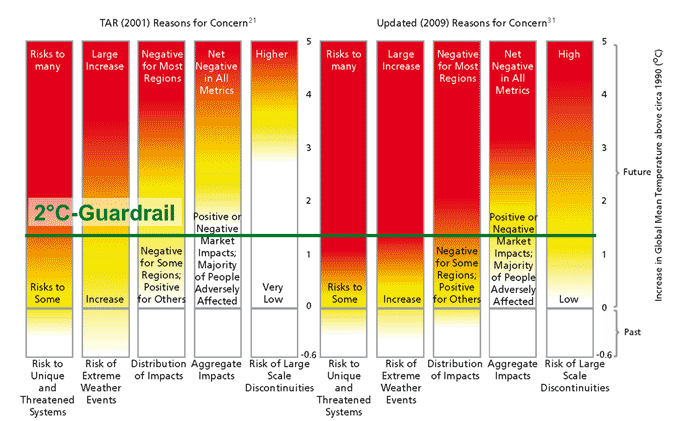
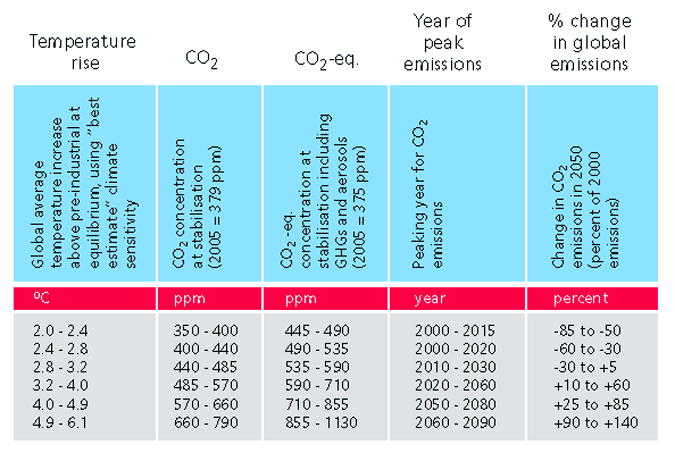
The impacts identified in the report are only a starting point; each area of impact has many implications. For example, a reduction in snowpack has implications for water supply, the timing and degree of flooding, water availability for irrigation, and potential disruption of local land use and economies. Similarly, water needed for fish habitat is related to agricultural use and also is related to land use and development. One of the major areas for additional research is in identifying the synergistic effects that may arise due to the combinations of different sets of effects. Washington’s EmissionsThe Energy Policy Division of the Washington Department of Commerce has sponsored a series of reports on Washington State’s greenhouse gas emissions. The following brief description of Washington’s GHG emissions is based on the most recent of these reports, Washington State Greenhouse Gas Inventory and Reference Case Projections, 1990-2020 , prepared by the Center for Climate Strategies. Figure 1-1 below compares Washington and U.S emissions for 2005. Transportation was the largest sector, with 47% of gross emissions, compared to only 28% for the U.S. While the per capita use of vehicle fuels is slightly less in Washington than in the U.S. as a whole, our much lower emissions from electricity generation result in this higher share. Primary fuel use by buildings— residential, commercial, and industrial or RCI — is about the same as the U.S. overall, at 20% Consumption-based electricity - that is all electricity consumed in Washington, not just generated here - is 20%. Once again, due to our large hydroelectric base, this proportion is much lower than the U.S. share at 34%. Agricultural emissions are comparable to the U.S. average, at 6% and 8% respectively. Washington’s industrial sector, heavily dependent upon low cost electricity, accounts for 4% of the state’s emissions, less than half of the national share. Figure 1-1 Gross Greenhouse Gas Emissions by Sector, 2005, Washington and US With the exception of a short dip during the 2001-02 recession, Washington’s emissions have climbed steadily over the last two decades. The greatest increases have come in transportation; these increases have far exceeded the small decreases in industrial processes and agriculture. Emissions in 2005 were 7% above 1990 levels. Under the business-as-usual reference forecast, emissions would rise to 17% above 1990 levels by 2010, and 38% above 1990 levels by 2020. Given that the current state policy calls for reducing GHG emissions to 1990 levels by 2020, it is clear that major changes to “business as usual” will be required. Figure 1-2. Washington Gross GHG Emissions by Sector, 1990-2020: Historical and Projected (Consumption-based) A Brief Report on the State of the ClimateThe IPCC Fourth Assessment established the reality of climate change and the role of anthropogenic greenhouse gas emissions in global warming. The UW Climate Change Group report above is largely based on the results of this compendium of climate research. However, much of the science reviewed for that report has since been updated. The International Scientific Congress on Climate Change held in Copenhagen earlier this year reviewed the latest science. In Chapter 1, we communicated the key messages from the “Copenhagen Synthesis”: scientists agreed that the climate system is already moving beyond the patterns of natural variability, including global mean surface temperature, sea-level rise, ocean and ice sheet dynamics, ocean acidification, and extreme climatic events. They report that worst case scenarios are already becoming reality and that, unless drastic action is taken soon, dangerous climate change is imminent. Previous climate change studies have led to a common consideration that limiting increases in global temperature to 2°C, roughly equivalent to an atmospheric CO2 concentration of 350-400 ppm, would be sufficient to avoid dangerous climate change. Due to better data and better understanding of climate dynamics, this 2°C “guardrail” is now seen as inadequate. The chart below shows the increased risks based on this new understanding. Global concentrations of CO2 are now around 385 ppm, and increasing at about 2 ppm per year. Immediate reductions in emissions of 60-80% would be needed to limit concentrations to 400ppm. This is clearly not a possibility; as a result, some overshoot of the 2° guardrail is inevitable. How far we overshoot — and how high global temperatures stabilize — depends on how quickly and how much we can reduce emissions. The table below, from the Copenhagen Synthesis, shows the relationship between the year of peak emissions, resultant concentrations in 2050, and likely temperature rise.
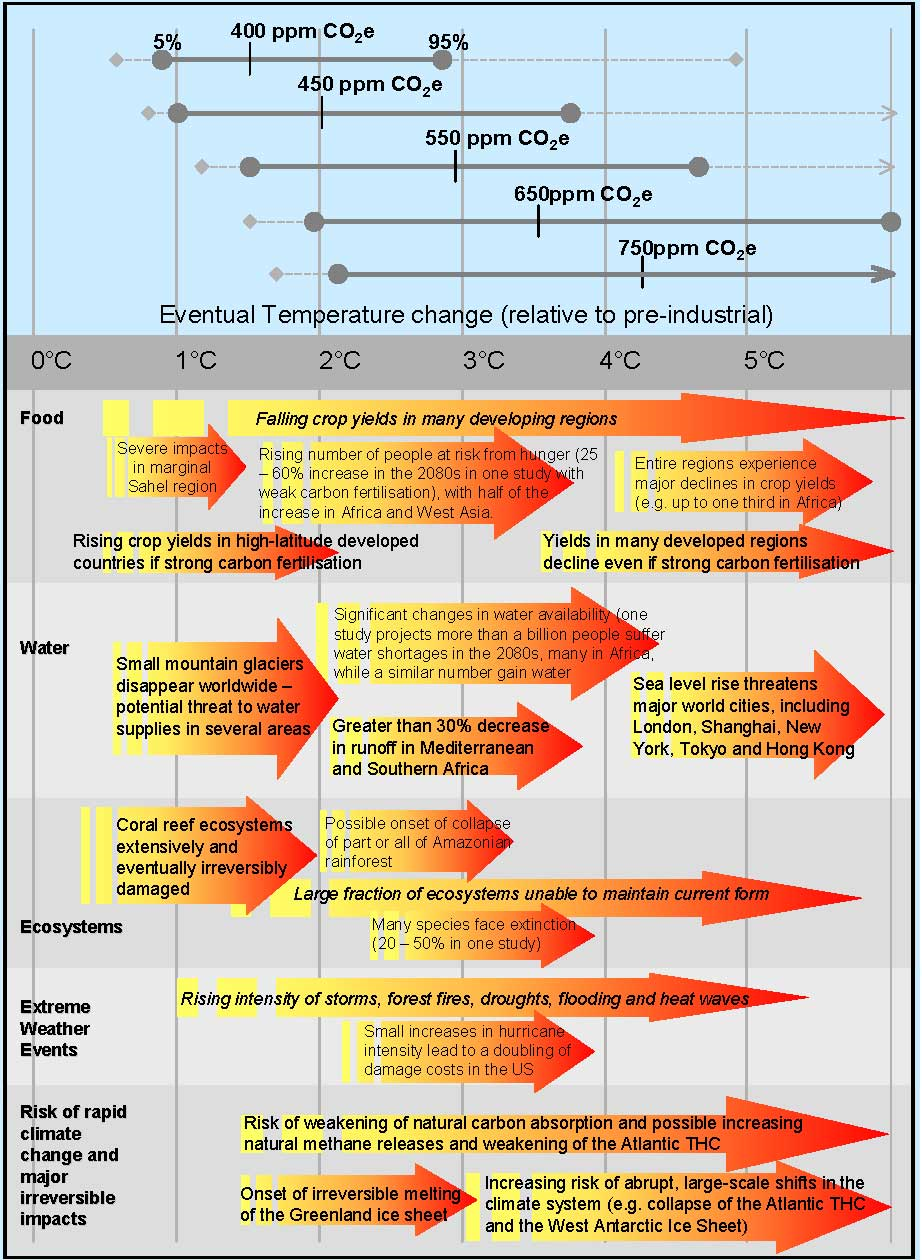
The final figure below is reproduced from the Stern Review Report on the Economics of Climate Change, a comprehensive 2006 report from the UK Office of Climate Change. The illustration attempts to relate various ranges of greenhouse gas concentrations to probabilities of temperature rise and examples of the types of effects that could result. While the report points out that the relationship between global temperature rise and regional climate change is still very uncertain and the subject of ongoing research, what is known is that change will occur, and that the global climate system will continue to change and reflect built-in impetus for change long after greenhouse gas levels in the atmosphere stabilize — if and when that occurs.
Footnotes 1 Evaluating Washington’s Future in a Changing Climate, Executive Summary, University of Washington Climate Impacts Group, February 2009. |
Upcoming Events
Wed Sep 23, 2026MRSC Webinar - Implementing and Monitoring Local Climate Plans Webinar Category: APA WA Events |
View Full Calendar
The Washington Planner
APA Washington's Monthly NewsletterRead the latest issue>>
Submit an article>>
Sponsors
